Difference between revisions of "Calculate cumulative contribution"
From Computational Biophysics and Materials Science Group
(Created page with " % ################################ % ## MATLAB script to calculate cumulative contributions from PCA results % ## Kevin Apr 2014 % ## Input: val.dat (1 col, from PCA) % #...") |
m |
||
| Line 1: | Line 1: | ||
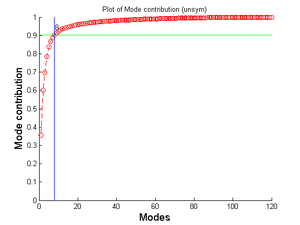
| + | [[File:Unsym cfl.png|thumb|300px]] | ||
% ################################ | % ################################ | ||
% ## MATLAB script to calculate cumulative contributions from PCA results | % ## MATLAB script to calculate cumulative contributions from PCA results | ||
Latest revision as of 16:24, 14 May 2014
% ################################
% ## MATLAB script to calculate cumulative contributions from PCA results
% ## Kevin Apr 2014
% ## Input: val.dat (1 col, from PCA)
% ## Output: cum.dat (similar to clf.dat from PCA, cumulative % contribution of the eigenvalues)
% ##         idv.dat (individual contribution from the eigenvalues, basically just for quiverc.m)
% ## Units:
% ## Notes: It will also give plot of the cum.dat with mode exceeding 90%
%           indicated. It is a bit slow. Dunno why.
% ################################

clear;
load('val.dat')

% Sum of eigenvalues
sum=sum(val(:,2));
tmp=0;
for i=1:120
    tmp=tmp+val(i,2);
    c(i)=tmp/sum;

    if c(i)>=0.9 && c(i-1)<=0.9
        ythr=c(i);
        xthr=i;
    end

    c=c';

    b(i)=val(i,2)/sum;
    b=b';
end

% Write cumulative contribution to file
fname=fopen('cum.dat','w');
fprintf(fname,'%2.6f\n',c);
fclose(fname);

% Write individual contribution of each mode to file
fname=fopen('idv.dat','w');
fprintf(fname,'%2.6f\n',b);
fclose(fname);

% Start plotting
figure;
hold on
plot(c,'--ro')
xlabel('Modes','fontsize',14)
ylabel('Mode contribution','fontsize',14)
title('Plot of Mode contribution (sym)')
plot(0:0.001:120,ythr,'-g')
plot(xthr,0:0.001:1,'-b')
ss=num2str(xthr);
text(xthr+0.3,ythr+0.04,ss)
hold off
