Instruction on plotting with Matlab and standard requirements
From Computational Biophysics and Materials Science Group
Contents
[hide]Plot several curves

Prepare raw data files such as file1.dat, file2.dat, file3.dat
Suppose they are all two-column files (x,y)
Create m-file as the following
s1=load('file1.dat');
s2=load('file2.dat');
s3=load('file3.dat');

figure;plot(s1(:,1),s1(:,2),'b','linewidth',2);  ### b represents blue, it is recommended to use 2 for linewidth
hold on; plot(s2(:,1),s2(:,2),'r--','linewidth',2);  ## r represents red
hold on; plot(s3(:,1),s3(:,2),'k*','linewidth',2);   ## k represents black
legend('data1','data2','data3');                     ## label each curve correctly (fontsize 16)
xlabel('Distance','fontsize',20);     ## fontsize is recommended to use 20 or 24
ylabel('Probability','fontsize',20);  ##
The legends and axis labels and numbers in all figures should be in large enough font so that they can still easily be seen when reduced in Size to the journal single column format used for their printed papers.
More
To obtain the effect shown on the right, google 'MATLAB Subplot'.
Plot in 2D or 3D
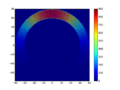
Example pcolor
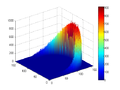
Example surf


Please refer to MATLAB documentation on 'pcolor', 'surf', etc. The following is a quick start example about how to use them.
s=load(filename); ## suppose your file is a mXn matrix.
figure;pcolor(s);shading interp;
figure;surf(s);shading interp;