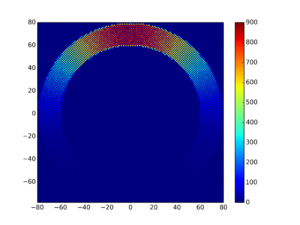
Ploting 2D Density Colorful
From Computational Biophysics and Materials Science Group
I think you guys can use the code in this way:
python plot2d.py -i ~/data.txt -o result.png --ignore=',' --ignore='(' --ignore=')' \
--format='* * cor_x cor_y *' --vmax=300 --vmin=100
To dynamically read your data file. :-)
import sys, getopt #parameters
import matplotlib.pyplot as plt
from matplotlib.colors import Normalize#LogNorm
from pylab import *

def plot(input_file, vmax, vmin, ignore, line_format, output_png, silent):
	xs = []
	ys = []
	index_x = line_format.split().index('cor_x')
	index_y = line_format.split().index('cor_y')
	with open(input_file) as f:
		for line in f:
			for _ignore in ignore:
				line = line.replace(_ignore, ' ')
			_line = line.split()
			xs.append(_line[index_x])
			ys.append(_line[index_y])


	#only for generate two array
	x = randn(len(xs))
	y = randn(len(ys))

	# Translate into x, y from xs, ys
	for i in range(0,1000000):
		x[i] = xs[i]
		y[i] = ys[i]

	# hist and plot
	plt.hist2d(x, y, bins=[x.max() - x.min() + 1, y.max() - y.min() + 1], vmin=vmin, vmax=vmax)
	plt.colorbar()
	if output_png is None:
		pass
	else:
		savefig(output_png, dpi=400)
	if silent:
		pass
	else:
		plt.show()
	return plt


def main(argv):
	# By Xinhong
	help_str = '''==============================================


plot2d.py -i <inputfile> [-o <output.png>] [--vmin] [--vmax] [--ignore] [--format]
vmin and vmax define the min and max of color origin.


--ignore:(can be used for multiple times)
Example: --ignore=',' means the ',' will be replaced by a space when dealing with the input.


--format:
Example: --format='cor_x cor_y * *' means each line is:
cor_x cor_y [other data] [other data]
if you do not specify the format, we will assume each line of the file is:
cor_x   cor_y
Pay attention! the format should be that after ignoring, for example, if each line is:
cor_x, cor_y, [other data]
then the command should be '  --ignore="," --format="cor_x cor_y *"  '


=============================================='''
	input_file = None
	vmin = None
	vmax = None
	ignore = []
	line_format ='cor_x cor_y'
	output_png = None
	silent = False
	try:
	  	opts, args = getopt.getopt(argv,"hi:o:s",["ifile=", "vmin=", "vmax=", "ignore=", "format="])
	except getopt.GetoptError:
	  	print(help_str)
	  	sys.exit(2)
	for opt, arg in opts:
		if opt == '-h':
		 	print(help_str)
		 	sys.exit()
		elif opt == '-o':
			output_png = arg
		elif opt in ("-i", "--ifile"):
			input_file = arg
		elif opt == '--vmin':
			vmin = arg
		elif opt == '--vmax':
			vmax = arg
		elif opt == '--ignore':
			ignore.append(arg)
		elif opt == '--format':
			line_format = arg
		elif opt == '-s':
			silent = True
	if input_file is None:
		print('Please specify input file.')
		sys.exit(2)

	figure = plot(input_file, vmax, vmin, ignore, line_format, output_png, silent)


if __name__ == "__main__":
   main(sys.argv[1:])
if you want to process a batch of files and only output the image without open it, try this:
FILES=/Users/Hung/Desktop/result/*
for f in $FILES;
do
	python3.3 /Users/Hung/Documents/git/random_walk/draw/plot2d.py -s -i $f -o ${f}.png --vmax=900 --vmin=0 --format="cor_x cor_y *";
done
